How to query Supabase data in PostHog
Aug 01, 2024

Combining your database and analytics data is a powerful way to understand your users. Supabase is a popular choice for handling that app data, as it provides a database, auth, storage, and more all-in-one.
Because Supabase is built on Postgres, we can link and query it in PostHog using our data warehouse. This tutorial shows you how to do that and provides some example insights you can create with the data afterward.
Linking Supabase data to PostHog
To start, you need both a Supabase and PostHog account. Once you have those, head to PostHog's data warehouse tab and:
Click Link source. (or, if you've already added a source, Manage sources then + New source)
Choose the Postgres option by clicking Link.
Go to your Supabase project settings and under configuration, click Database.
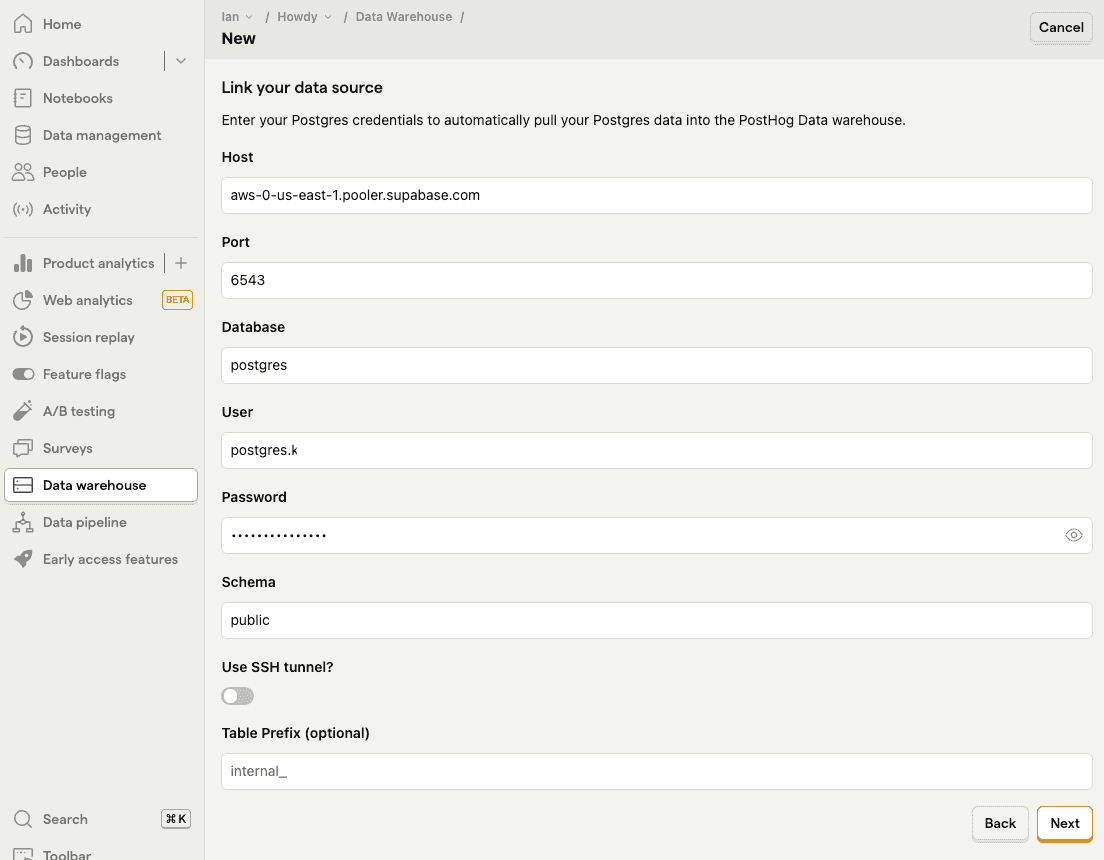
Fill out the PostHog data warehouse link fields with your Supabase data.
- Under connection parameters, copy host, database name, port, and user (database name in Supabase is just
databasein PostHog)

- Enter the password you set for your database.
- Choose the schema you want to import. See the Supabase table editor for details on what each one has.
publicis the default, but we also useauthandextensionslater in this tutorial.
- Under connection parameters, copy host, database name, port, and user (database name in Supabase is just
Once you add the details, click Next.
- Choose set up the sync methods, choose the tables you want to include, and click Import to start the sync.
Once it completes, you can then query the data in PostHog.
Querying Supabase data in PostHog
You can query your Supabase data using SQL insights. This enables you to combine it with your PostHog usage data.
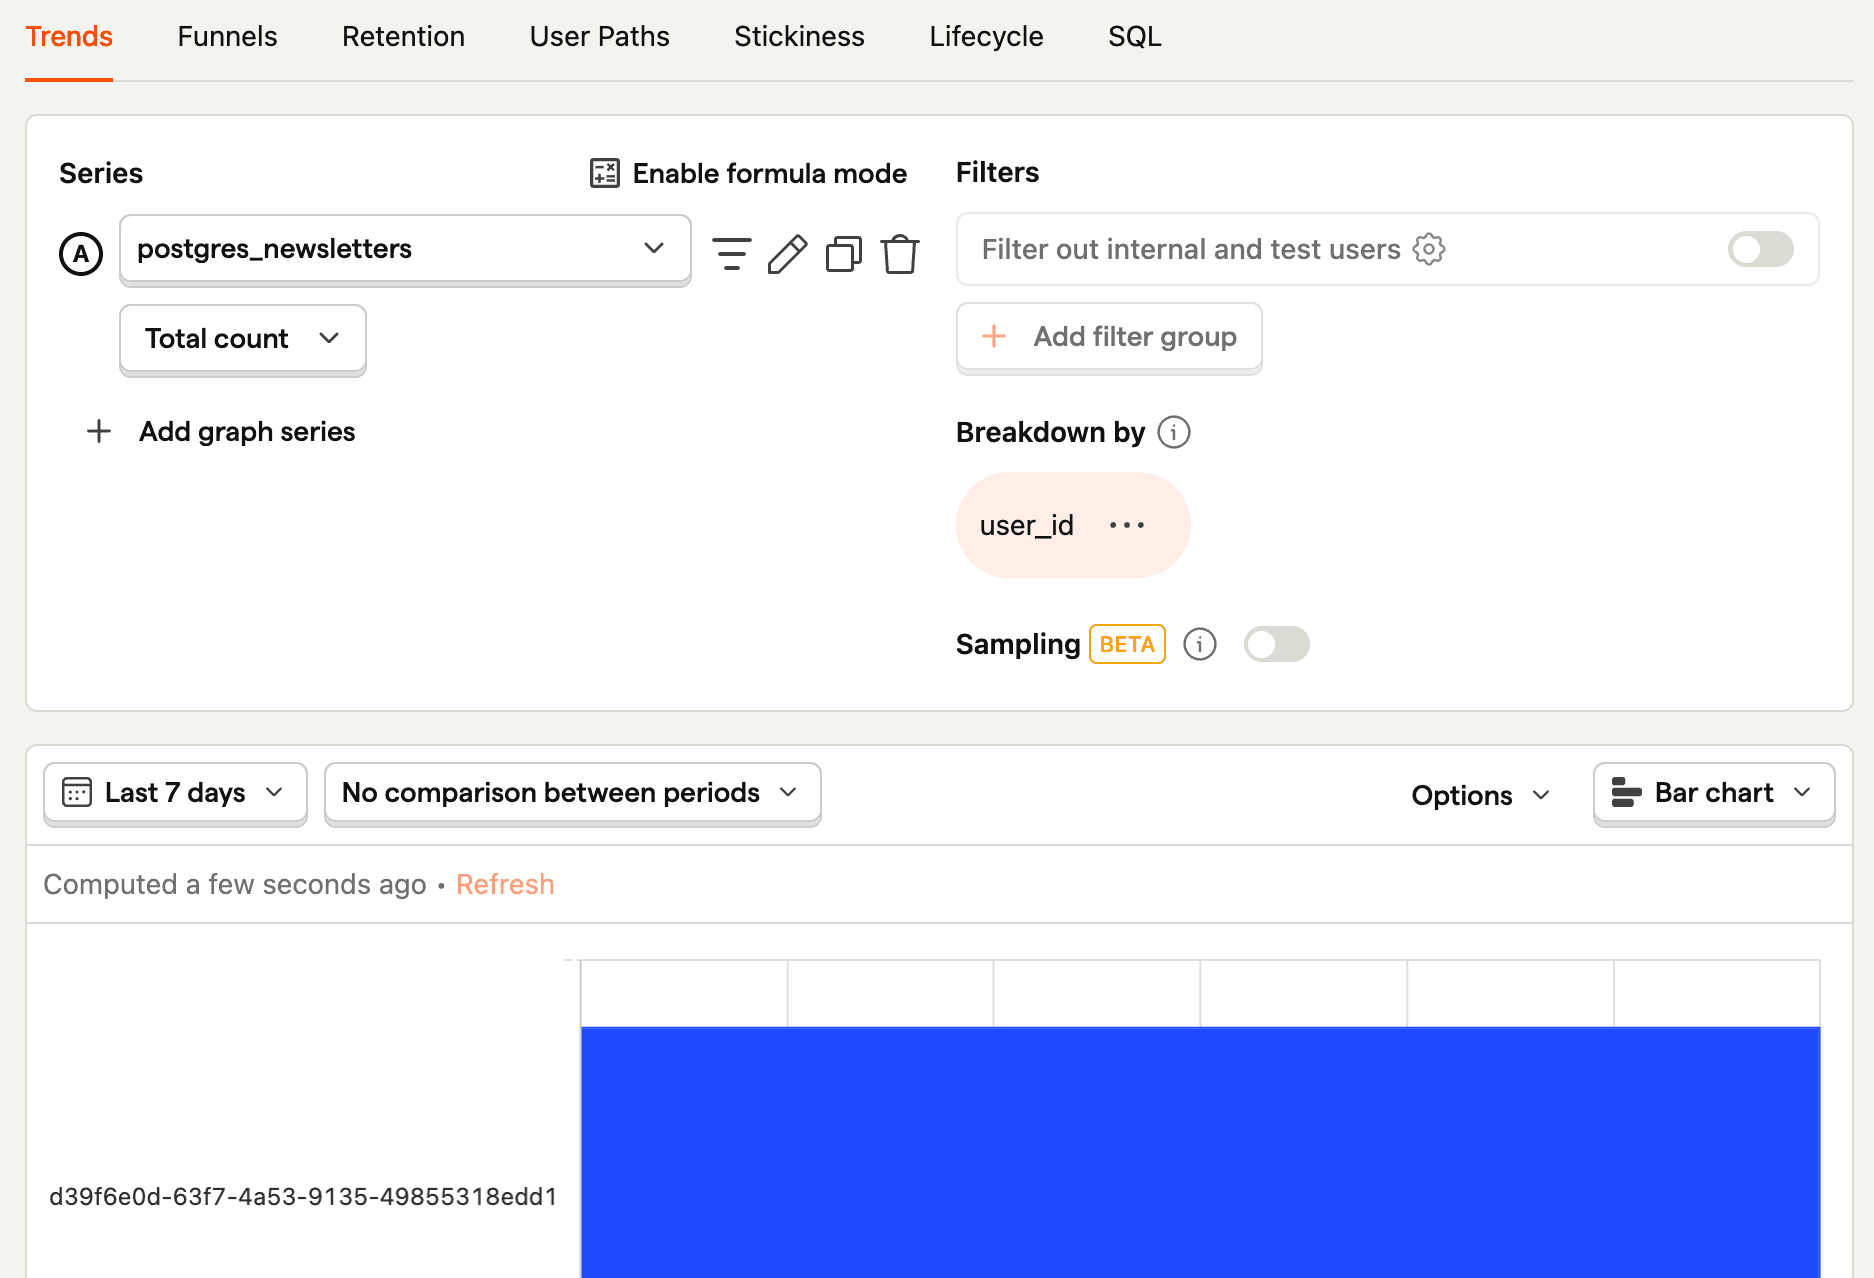
Visualizing the count of objects over time
You can use trends to visualize your data. For example, to visualize a count of objects over time:
- Create a new insight.
- As a series, search for
postgresand select your table. For us, that ispostgres_newsletters. - Ensure your ID, distinct ID, and timestamp fields are correct and press Select.
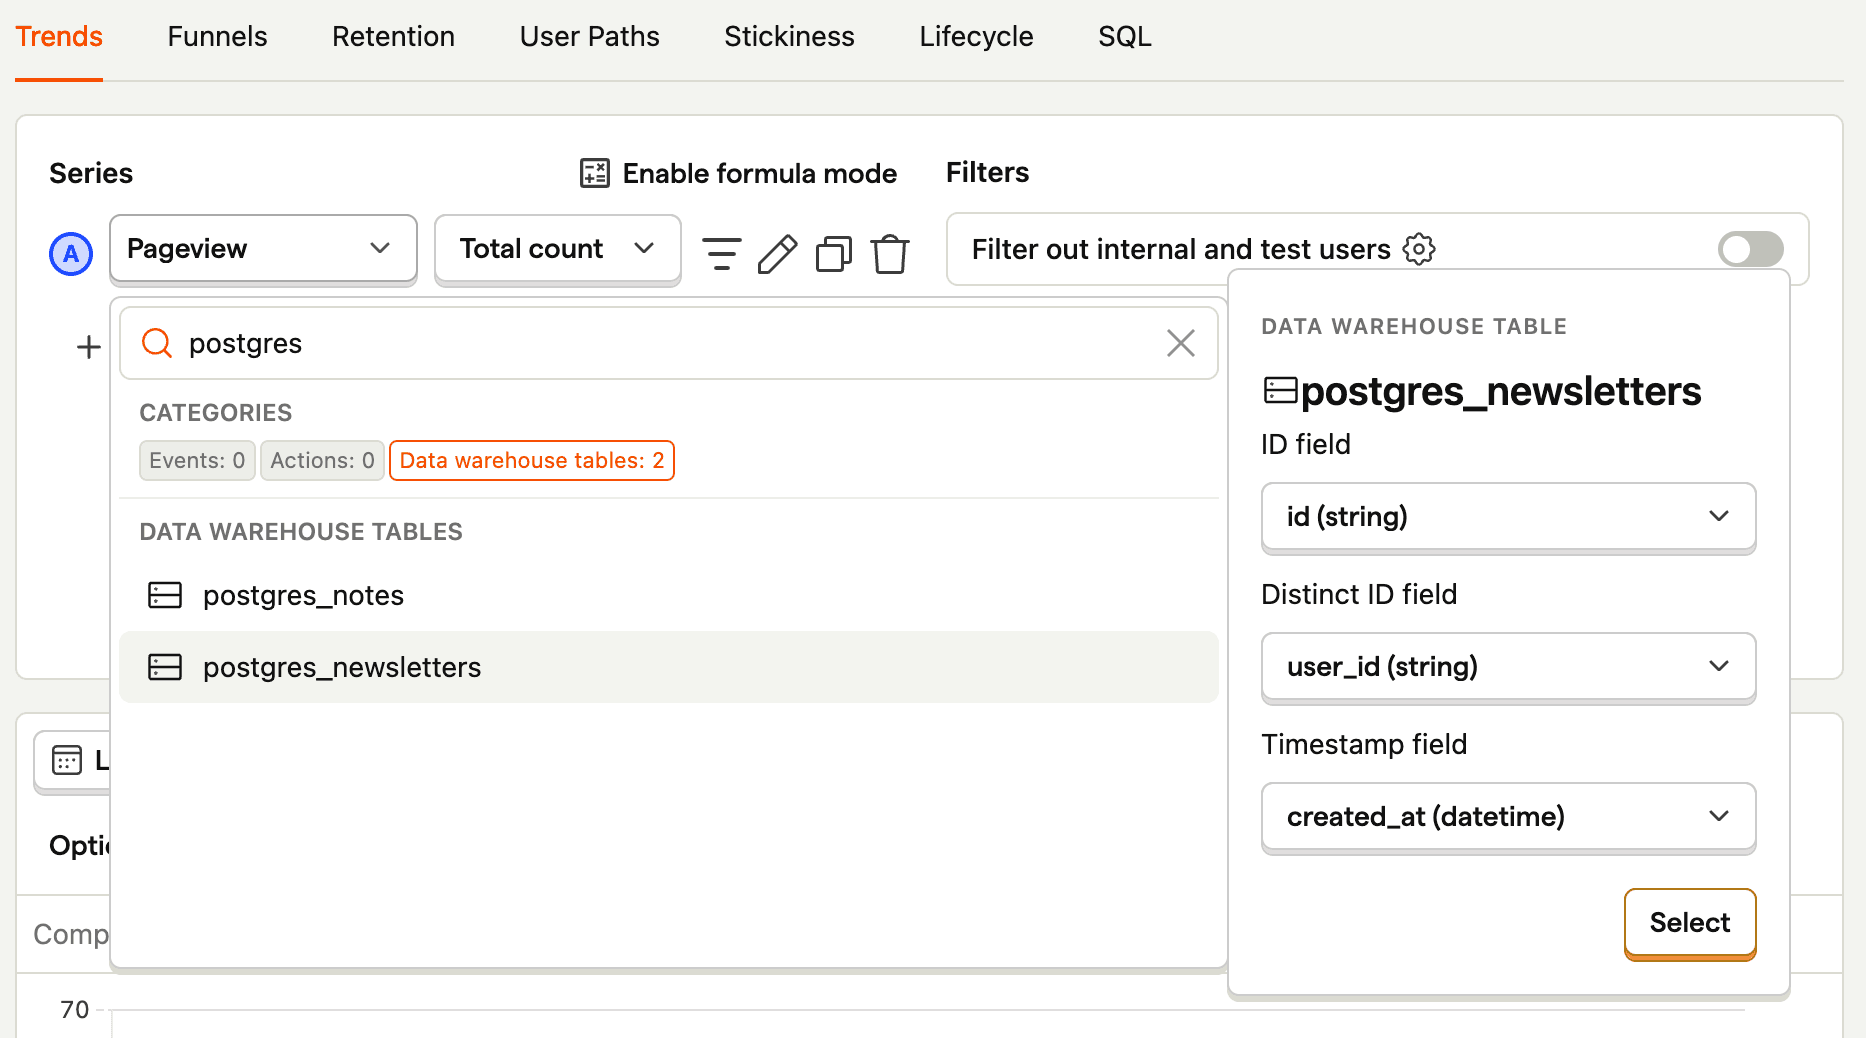
This creates a trend of the count of the objects in your table over time. You can then modify it using filters, visualization options, and breakdowns. For example, to break down by user_id, click Add breakdown, select the Data warehouse properties tab, and then choose user_id. To visualize this nicely, you can change the line chart to a total value bar chart.
Combined user overview
Linking your Supabase user table (under the auth schema) enables you to get an overview of user data across both sources. This does require you to add a table prefix like supabase_ if you already have a Postgres source linked.
To create this overview, create a new SQL insight that:
- Gets
email,last_sign_in_at,created_atfrom Supabase'susertable - A count of events from PostHog's
eventtable - Join the tables using
emailanddistinct_id
Altogether, this looks like this:
We could also PostHog person properties or a Supabase table to these by joining more tables to this query.
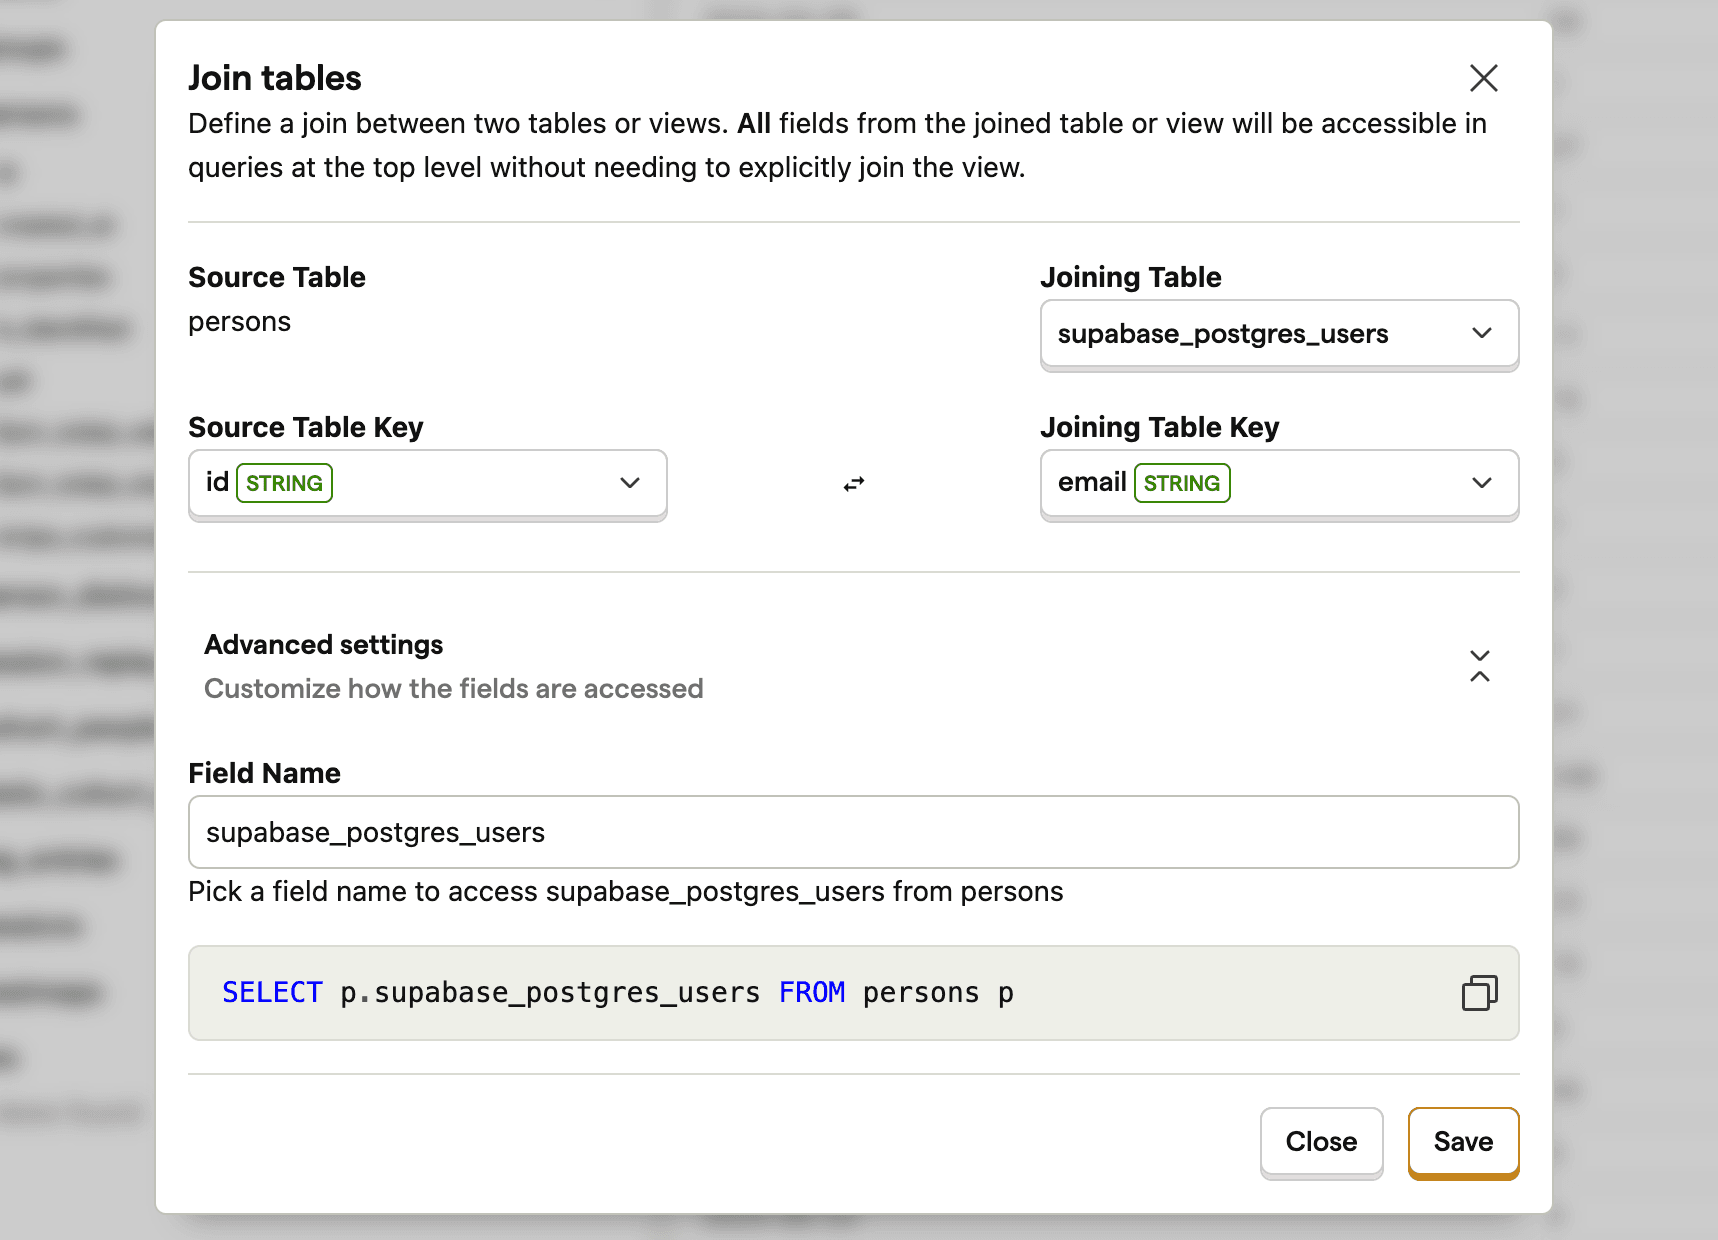
Tip: You can also set up a join between PostHog's
personstable and your Supabaseuserstable. Go to the data warehouse tab, click the three dots next to thepersonssource, and click Add join. This enables you to use Supabaseusersdata wherever you can use persons.
Usage by paid users
Similar to the last query, we can get a list of paid users from Supabase by filtering for users with a paid column (or equivalent) set to true. We can then use this list to analyze their PostHog usage.
If your payment details were on another table, you could also join that table.
Querying observability stats
Supabase also captures observability data we can query if you link the pg_state_statements table from the extensions schema.
An example of a query you could get from this is p95 total execution time along with the median rows read:
Another example is the most time-consuming queries:
One more for good luck, this gets queries with high variability: